Reducing Process Variability Using Control Charts
Read this article and find out more about how to reduce process variability using control charts.
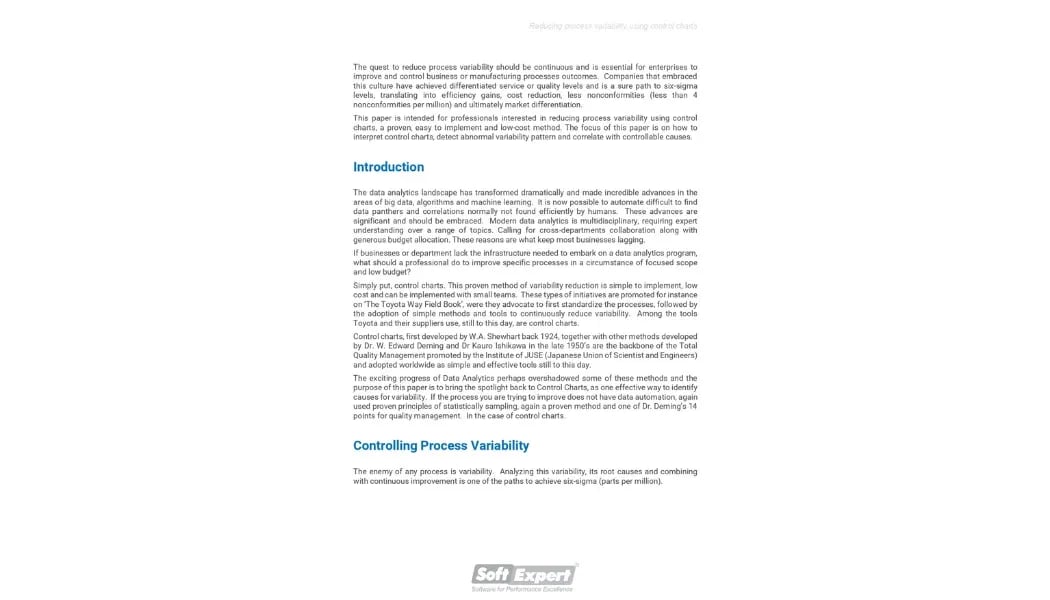
The quest to reduce process variability should be continuous. It is moreover essential for enterprises to improve and control business or manufacturing process outcomes.
Companies that have embraced this culture have been capable of providing service differentials or quality levels and is a sure path to reaching six-sigma levels, resulting in gains in efficiency, reduced costs, fewer nonconformities (less than 4 nonconformities per million) and, ultimately, an edge in the market.
In this article, Daniel Lago shows how to reduce variability in processes by using control charts, a proven, easy to implement and low-cost method. You will learn how to interpret control charts, detect abnormal variability patterns and correlate them with controllable causes.
Bültenimize abone olun
Önde gelen şirketler çözümlerimize güveniyor




5,000 automated processes: Lyon Engineering reduces errors and increases efficiency

Dünyanın önde gelen mühendislik ürünü tıbbi sınıf kollajen ve diğer biyomalzemeler tedarikçisi, kalite yönetimi ve tasarım kontrollerini SoftExpert ile dönüştürüyor.


By adopting the SoftExpert platform, Tegma has integrated all its applications into a single repository and collaborative environment, taking advantage of the cloud to simplify management and efficiently scale its business.

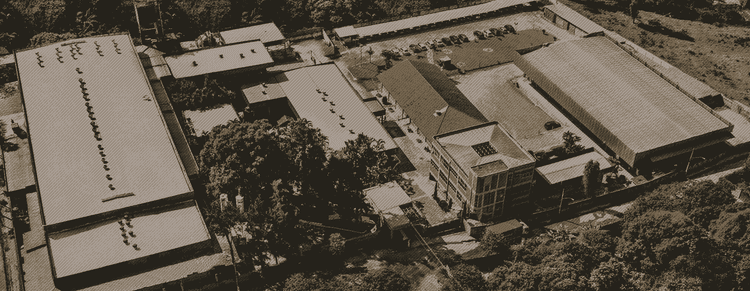
Hypofarma integrates ERP with SotExpert Suite on AWS and improves the efficiency of its processes by 80%


With savings exceeding $1 million and a 1000% ROI, the solution consolidated systems, automated tasks, and is preparing the company for an even more efficient future




Küresel Düşünce, Yerel Hizmet
SoftExpert'in her kıtada faaliyet gösteren küresel varlığı, her yerel pazara özel güçlü ve kişiselleştirilmiş hizmet sunarak büyümesini destekliyor.
Bize ulaşın